What is 'Pulse' and how to read the metrics
'Pulse' is the live dynamics of promotion for each link and the project as a whole. It answers the question that publication reports do not show: what did it give me. Positions, clicks, and impressions from Google Search Console, visits from Google Analytics, publication indexing, and link profile strength are collected automatically every night.
Where 'Pulse' is found
- Project link table — the 'Pulse' column with a badge for each page.
- Project card — colored badges with overall dynamics.
- Dashboard — compact badges in the project list.
- Mobile app — the same metrics for the project and links.
Project badges
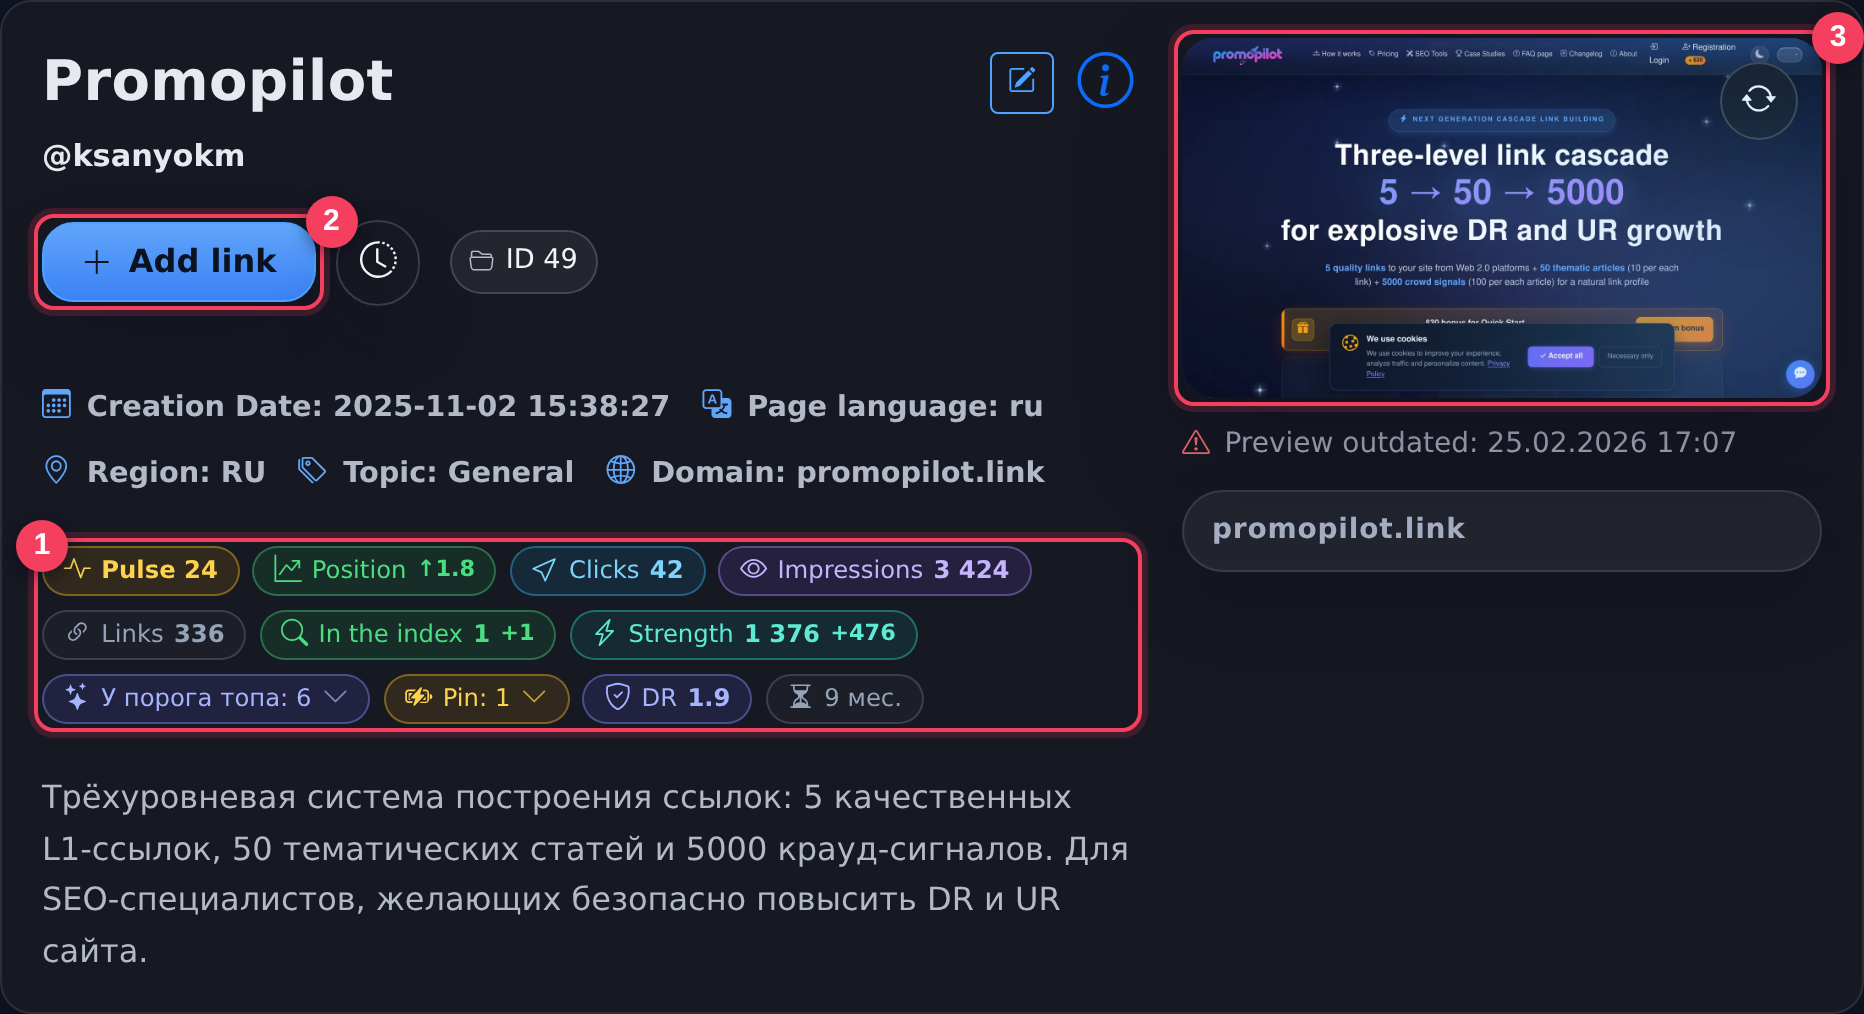
- Pulse badges — overall rating, best growing metric, built links indexed, profile strength, domain DR, and its age. The 'Time to secure' and 'At the top threshold' badges are clickable: a list of specific pages will open.
- Add link — a new project page enters the same table and receives its own 'Pulse' after the first launch.
- Site preview — a screenshot of the project's main page, updated automatically.
Link card
Clicking on the badge in the table opens the full picture for a specific page.
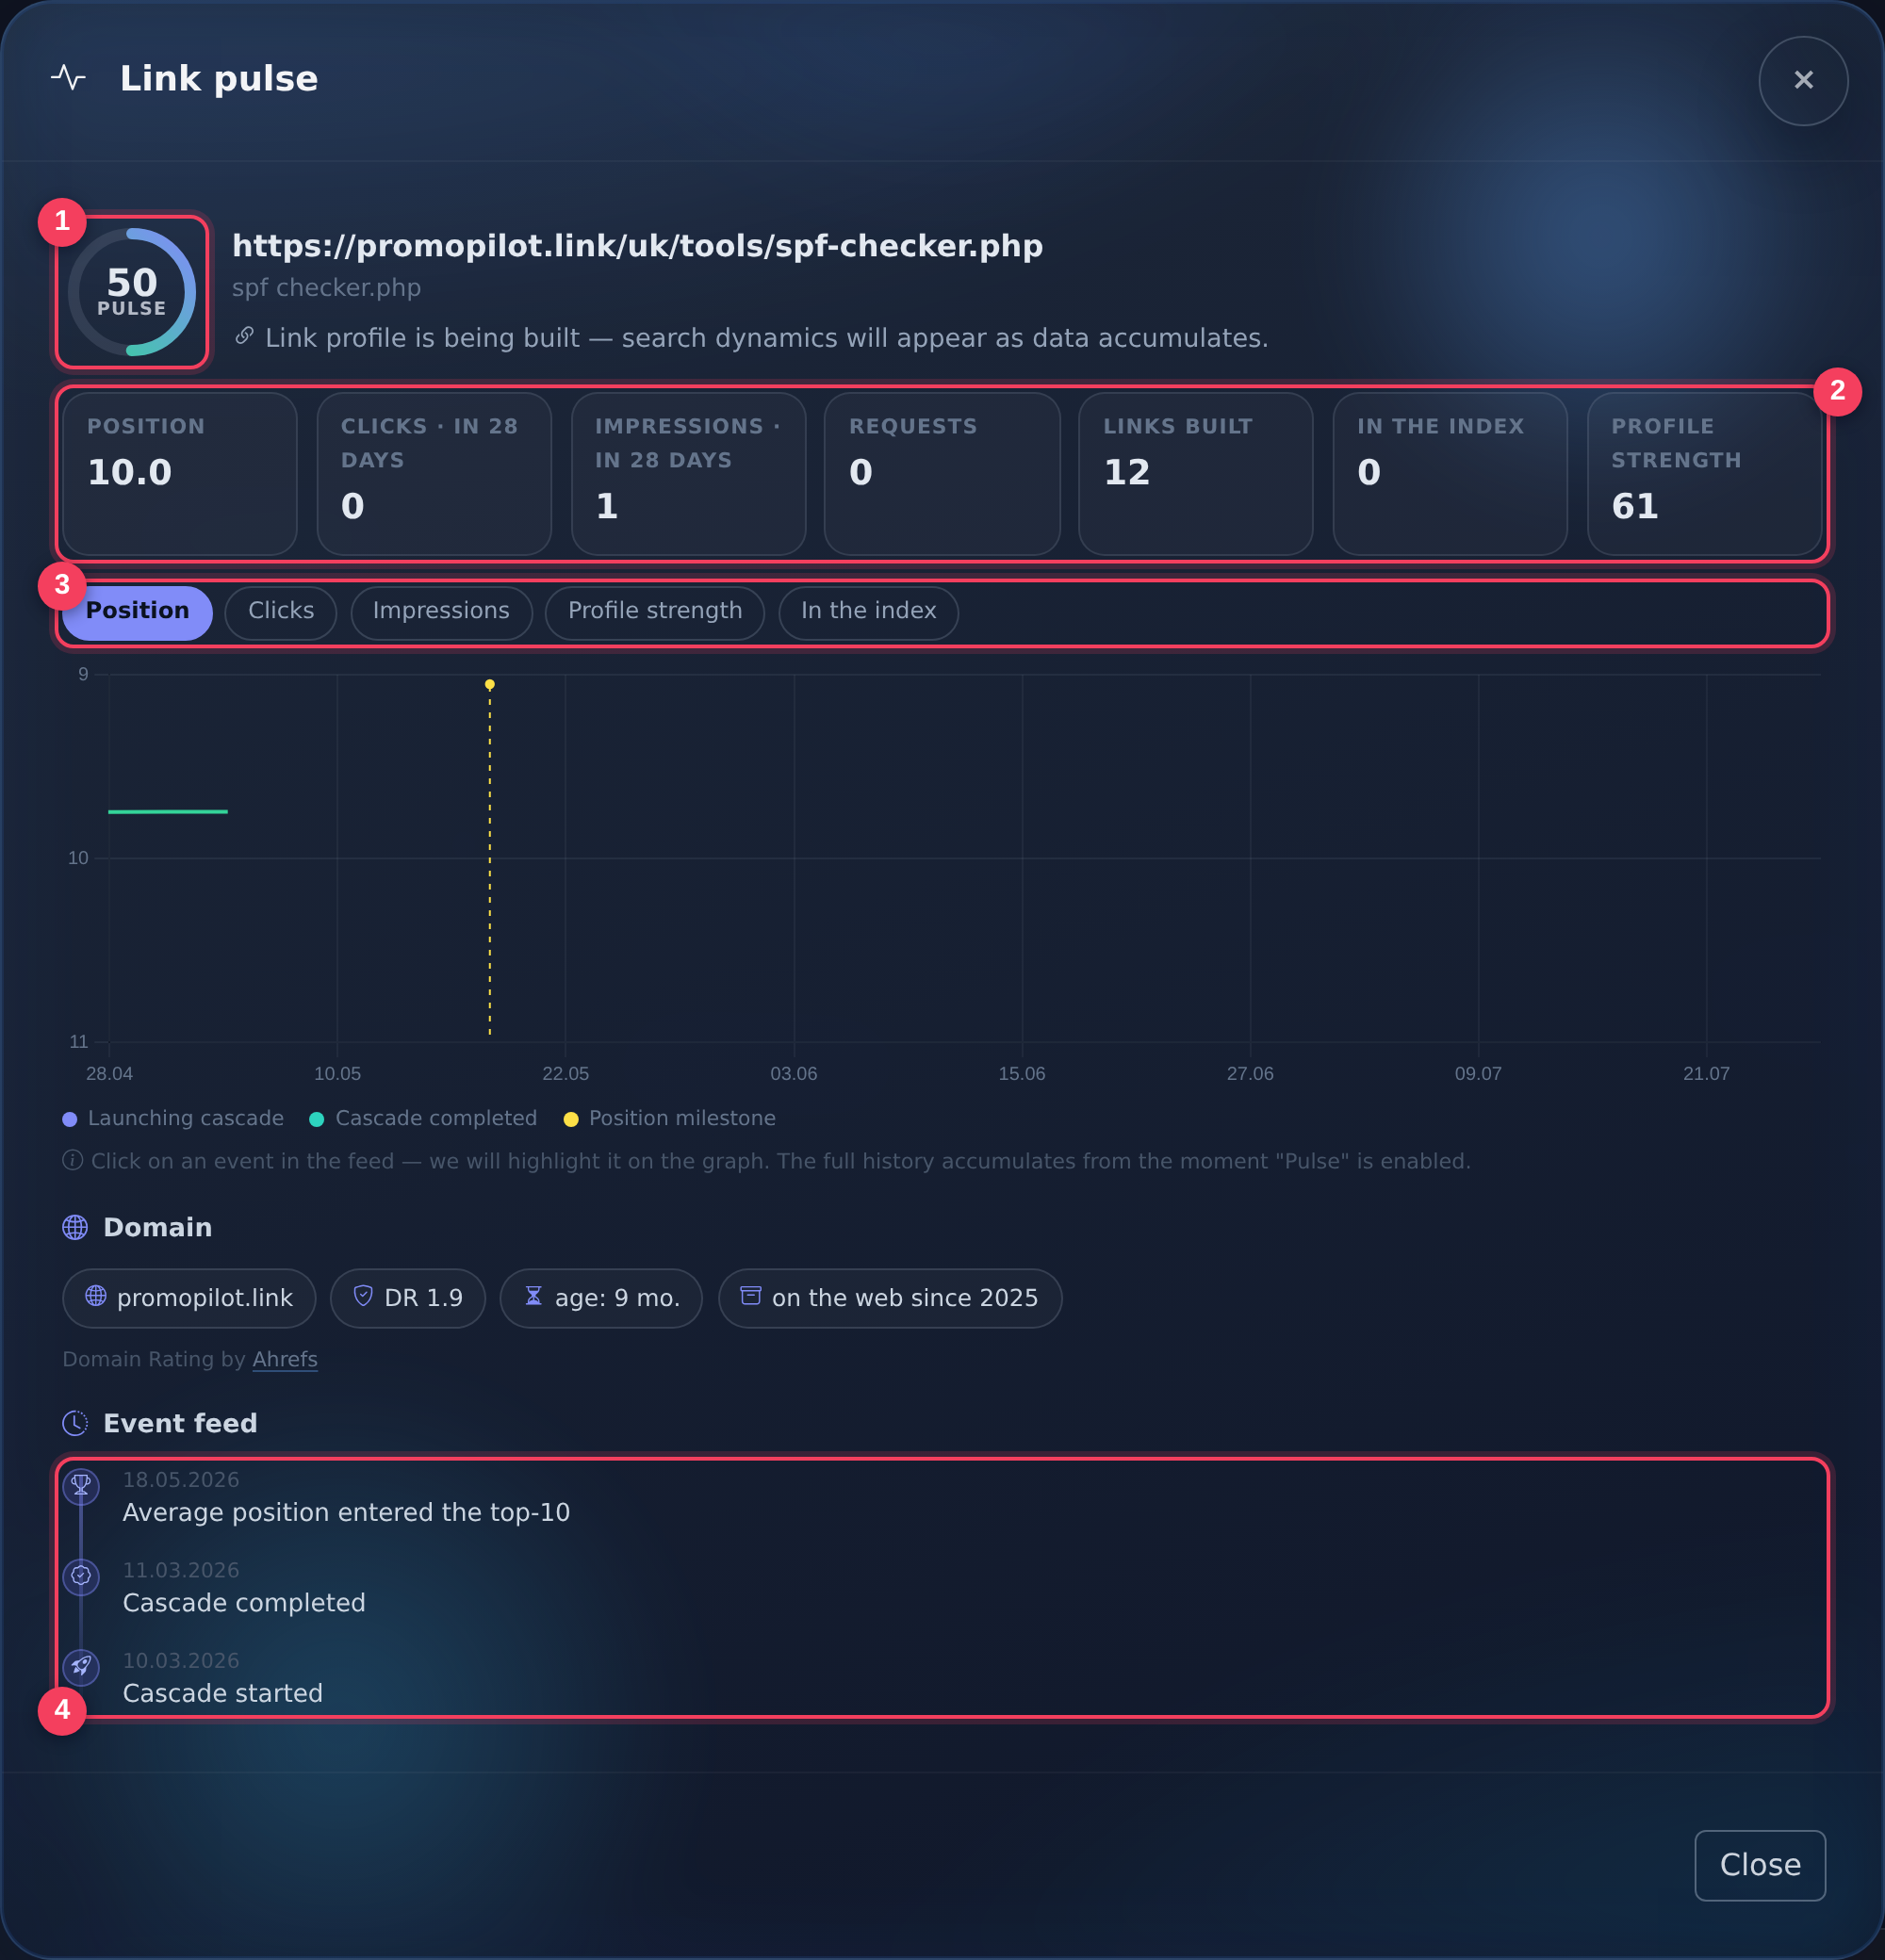
- Pulse rating 0–99 — a summary health index of the page. It is composed of the quality of the link profile, search position, coverage, and domain authority.
- Metrics for 28 days — position, clicks, impressions, number of requests, built links indexed, and profile strength.
- Metrics switch — the chart is rebuilt under the selected metric. For position, the scale is inverted: the higher the line, the closer to the top.
- Event feed — launches and completions of cascades, spikes in indexing, milestones like entering the top 10. Clicking on an event highlights it on the chart, and hovering over the mark shows what happened on that day.
What each metric means
| Metric | Source | Meaning |
|---|---|---|
| Position | Google Search Console | Average position of the page in the results for the period. Lower is better. |
| Clicks | Google Search Console | How many times the page was accessed from search. |
| Impressions | Google Search Console | How many times the page appeared in the results. Increases before clicks — an early sign of progress. |
| Requests | Google Search Console | How many queries the page is visible for. Growth means expanded coverage. |
| Visits and conversions | Google Analytics 4 | Appear if GA4 is connected. |
| Links built | Platform data | How many publications the cascades have made for this page. |
| In index | Own checks | How many publications were found in Google's index by our check. |
| Profile strength | Platform calculation | Cascade levels multiplied by the authority of the platforms and indexing status. |
| DR | Domain Rating by Ahrefs | Domain authority from 0 to 100. |
Badge statuses
Next to each link, one metric is displayed — the one that is currently growing. The priority is as follows: position, clicks, visits, requests, impressions, indexing, profile strength.
- Green badge with growth — the metric has risen above the significance threshold. Small fluctuations do not change the badge.
- 'Time to secure' — the effect of the previous cascade has begun to fade. Normal mechanics: the peak comes in two to three months, after which the momentum cools without support.
- 'To top 10' — the page is in positions 4–20, and a cascade for it will give the fastest effect.
- Neutral fact — for example, 'Links: 12 · in index 9', when there is no growth yet.
- 'After cascade launch' — there have been no launches for this page yet, so there is nothing to show.
Where the data comes from
The link part is calculated based on your cascades and is always available. Positions, clicks, impressions, and requests come from Google Search Console — they are only visible after connecting Google Search Console in the cabinet. Visits and conversions are added if Google Analytics 4 is connected. Domain data (DR, age) is updated every few days.